The Cytoscape Ecosystem & NDEx Network Cloud
The Ideker lab is involved in development of bioinformatic resources that are widely used in biomedical research. The most visible of these is the network analysis platform Cytoscape (cytoscape.org). It is a principal tool used by researchers to create and visualize models of molecular interaction networks, with approximately 20,000 downloads per month and >22,000 citations to the original Cytoscape marker paper (Shannon et al. Genome Research 2003). More than half of these citations have been added in the past five years, underscoring the continued relevance of the software and promoting the marker paper to the status of most highly cited work in the journal Genome Research. The platform now includes a cloud-based storage system for networks (Pratt et al. Cell Systems 2015). We recently released significant new Cytoscape functionality for detecting communities of proteins (in protein-protein interaction networks) or cells (in single-cell RNA sequencing data) (Zheng et al., Genome Biol. 2021; Singhal et al. PLoS Comp. Bio. 2020).
Cytoscape is an open source bioinformatics software platform for visualizing molecular interaction networks and integrating these interactions with gene expression profiles and other state data.
The NDEx Project provides an open-source framework where scientists and organizations can find, store, share and publish biological network knowledge. The project maintains a free Public Server and an informational website with technical documentation.
Community Detection APplication and Service (CDAPS)
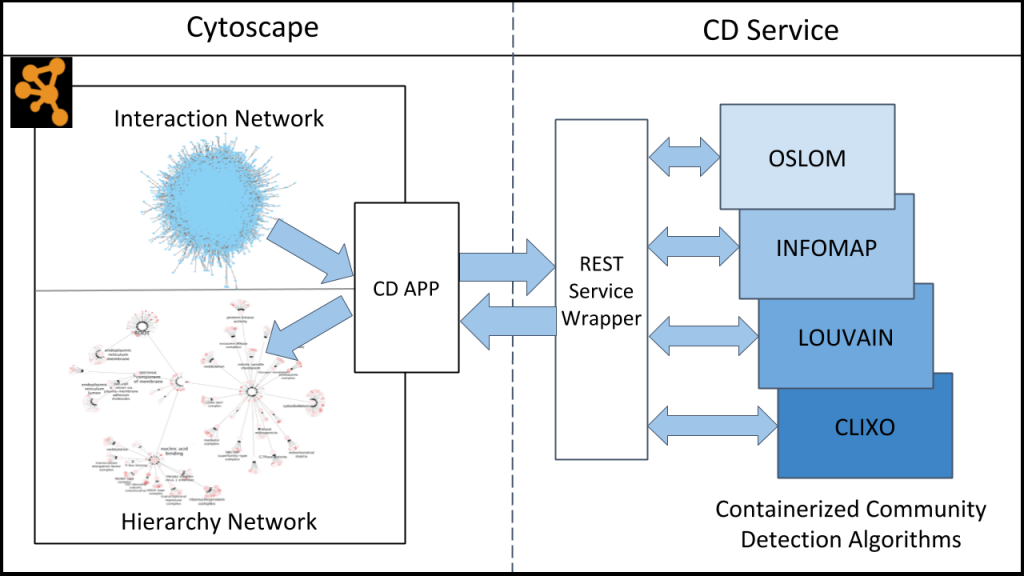
The Community Detection APplication and Service (CDAPS) framework performs multiscale community detection and functional enrichment for network analysis through a service-oriented architecture. These features are provided by integrating popular community detection algorithms and enrichment tools available via CyCommunityDetection, a Cytoscape application that acts as a client to a dedicated REST server. The server runs all the algorithms and tools remotely and can be launched locally. Its source code and documentation are available at Github.
Related papers: Singhal A, Cao S, Churas C, Pratt D, Fortunato S, Zheng F, et al. (2020) Multiscale community detection in Cytoscape. PLoS Comput Biol 16(10): e1008239. [PDF]
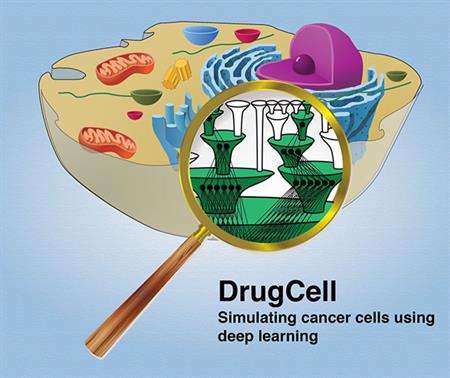
DrugCell is an interpretable deep learning model of human cancer cells trained on the responses of 1,235 tumor cell lines to 684 drugs. Analysis of DrugCell mechanisms leads directly to the design of synergistic drug combinations, which we validate systematically by combinatorial CRISPR, drug-drug screening in vitro, and patient-derived xenografts. DrugCell provides a blueprint for constructing interpretable models for predictive medicine. Source code is available via Github.
Related papers: Kuenzi B.M. et al. Predicting Drug Response and Synergy Using a Deep Learning Model of Human Cancer Cells. Cancer Cell, Volume 38, Issue 5. 2020
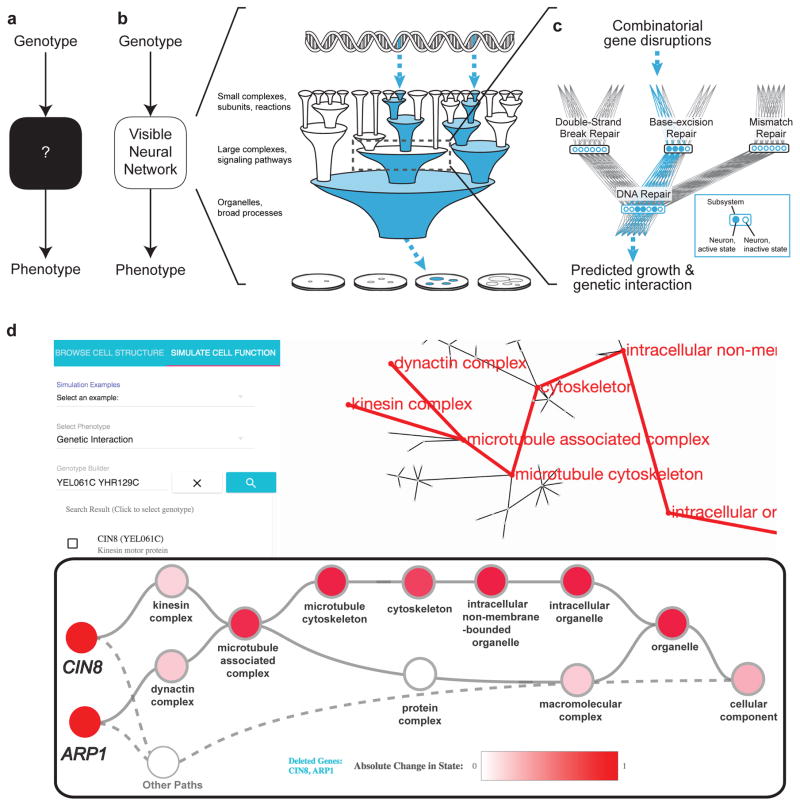
DCell is a VNN embedded in the hierarchical structure of 2,526 subsystems comprising a eukaryotic cell. Trained on several million genotypes, DCell simulates cellular growth nearly as accurately as laboratory observations. DCell provides a foundation for decoding the genetics of disease, drug resistance and synthetic life. Source code is available via Github.
Related papers: Ma J, Yu MK, Fong S, Ono K, Sage E, Demchak B, Sharan R, Ideker T. Using deep learning to model the hierarchical structure and function of a cell. Nat Methods. 2018 Apr;15(4):290-298. doi: 10.1038/nmeth.4627. Epub 2018 Mar 5. PMID: 29505029; PMCID: PMC5882547.
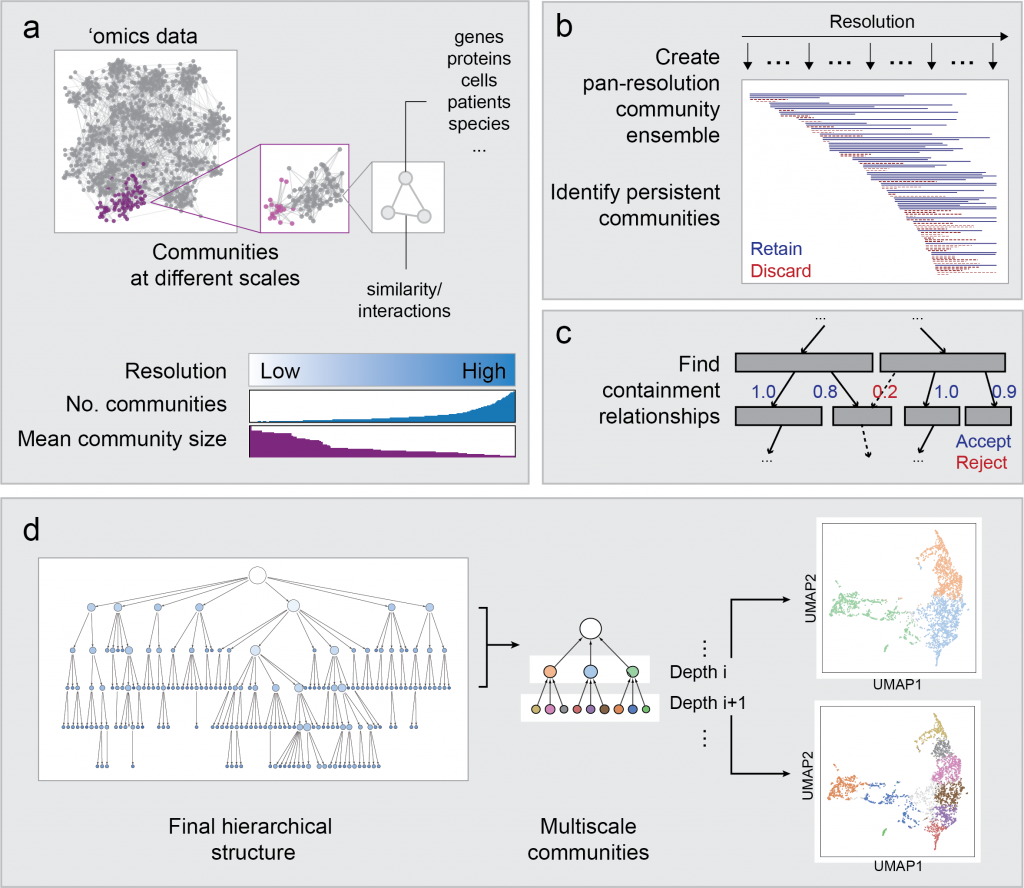
Hierarchical Community Decoding Framework (HiDeF)
In any ‘omics study, the scale of analysis can dramatically affect the outcome. For instance, when clustering single-cell transcriptomes, the analysis can be tuned to discover broad or specific cell types. Likewise, protein communities revealed from protein networks can vary widely in size depending on the method. HiDeF uses the concept of persistent homology, drawn from mathematical topology, to identify robust structures in data at all scales simultaneously. HiDeF is available via Python and Cytoscape.
Related paper: Zheng, F et al. HiDeF: identifying persistent structures in multiscale ‘omics data. Genome Biol 22, 21 (2021). https://doi.org/10.1186/s13059-020-02228-4 [PDF] [PubMed]
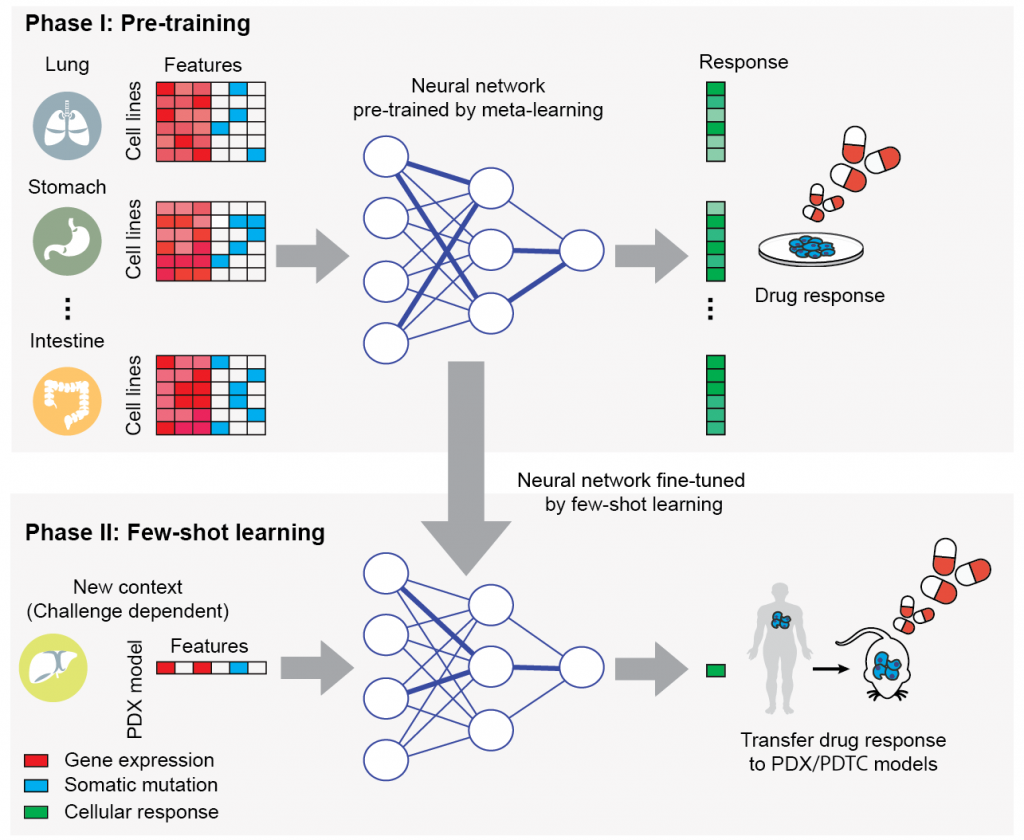
Translation of Cellular Response Prediction (TCRP)
We apply a recently developed technique, few-shot machine learning, to train a versatile neural network model in cell lines that can be tuned to new contexts using few additional samples. The few-shot learning framework provides a bridge from the many samples surveyed in high-throughput screens (n-of-many) to the distinctive contexts of individual patients (n-of-one).
Related paper: Ma, J. et al. Few-shot learning creates predictive models of drug response that translate from high-throughput screens to individual patients. Nat Cancer (2021). [PDF]
Network Assisted Genomic Analysis (NAGA)
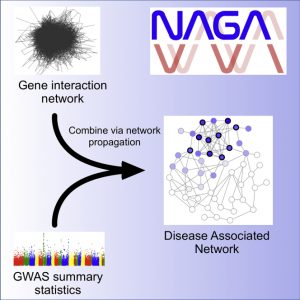
NAGA is designed to use biological networks to analyze GWAS results. NAGA assigns each gene with an association score based on the given GWAS result. To integrate prior biological knowledge, NAGA downloads a molecular network from the NDEx (hyperlink NDEx?) database and performs network propagation, providing a set of new scores for each gene. The high scoring genes form a new subnetwork, which can be compared to a set of gold standard genes in order to evaluate the enrichment for previously discovered biology.
Related paper: Carlin D.E. et al. A Fast and Flexible Framework for Network-Assisted Genomic Association. iScience. 2019 [PDF][PubMed]
Data-Driven Ontology Toolkit (DDOT)
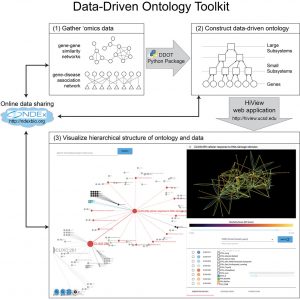
DDOT is a toolkit for constructing, analyzing, and visualizing data-driven ontologies. DDOT consists of a Python package to assemble and analyze ontologies and HiView, a web application, to visualize them.
Related paper: Yu M.K. et al. DDOT: A Swiss Army Knife for Investigating Data-Driven Biological Ontologies. Cell Syst. 2019 Mar 27;8(3):267-273.e3. doi: 10.1016/j.cels.2019.02.003. Epub 2019 Mar 13. PMID: 30878356; PMCID: PMC7042149. [PDF] [PubMed]
pyNBS (New code) | NBS (Old code)
Network based stratification (NBS), is a method for stratification (clustering) of patients in a cancer cohort based on genome scale somatic mutations measurements and a gene interaction network.
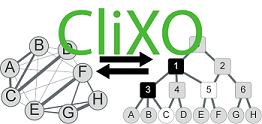
The Clique Extracted Ontologies algorithm (CliXO) infers an ontology in the form of a hierarchical, directed acyclic graph (DAG) from pairwise similarity data. Originally developed for inferring gene ontologies from biological gene networks.
View all plugins at the Cytoscape App Store: https://apps.cytoscape.org/apps/cycommunitydetection
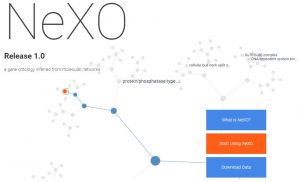
The Network Extracted Ontology (NeXO) is a gene ontology inferred directly from large-scale molecular networks. NeXO uses a principled computational approach which integrates evidence from hundreds of thousands of individual gene and protein interactions to construct a complete hierarchy of cellular components and processes.
Legacy Software
Cell Circuit Search: Molecular interaction models provide us with a framework for integrating the large-scale data that we are now able to collect at multiple levels of biological information – genes, RNAs, proteins, and small molecules. Cell Circuit Search is a web-based interface for searching for genes that appear in our library of network models.
NetworkBLAST Software: NetworkBlast analyzes protein interaction networks in order to predict previously unknown relationships. It can compare multiple species’ protein interaction networks and infer interactions through homology. The program is best used in conjunction with Cytoscape to easily visualize the returned data.
PathBLAST Website: Pathway alignment and query against protein interaction databases to identify conserved protein interaction networks between species. PathBLAST searches the protein-protein interaction network of the target organism to extract all protein interaction pathways that align with a pathway query.
VERA and SAM: VERA and SAM was developed to address the need for a better statistical test for identifying differentially-expressed genes. VERA estimates the parameters of a statistical model that describes multiplicative and additive errors influencing an array experiment, using the method of maximum likelihood. SAM gives a value, lambda, for each gene on an array, which describes how likely it is that the gene is expressed differently between the two cell populations and was developed to address the need for a better statistical test for identifying differentially-expressed genes.
Dapple: Dapple is a program for quantitating spots on a two-color DNA microarray image. Given a pair of images from a comparative hybridization, Dapple finds the individual spots on the image, evaluates their qualities, and quantifies their total fluorescent intensities. Dapple is designed to work with microarrays on glass and is a program for quantitating spots on a two-color DNA microarray image.
enoLOGOS: Program enoLOGOS generates LOGOs of transcription factor DNA binding sites from various types of input matrices. It can utilize standard count matrices, probability matrices or matrices of “energy” values (i.e., log-frequencies).
